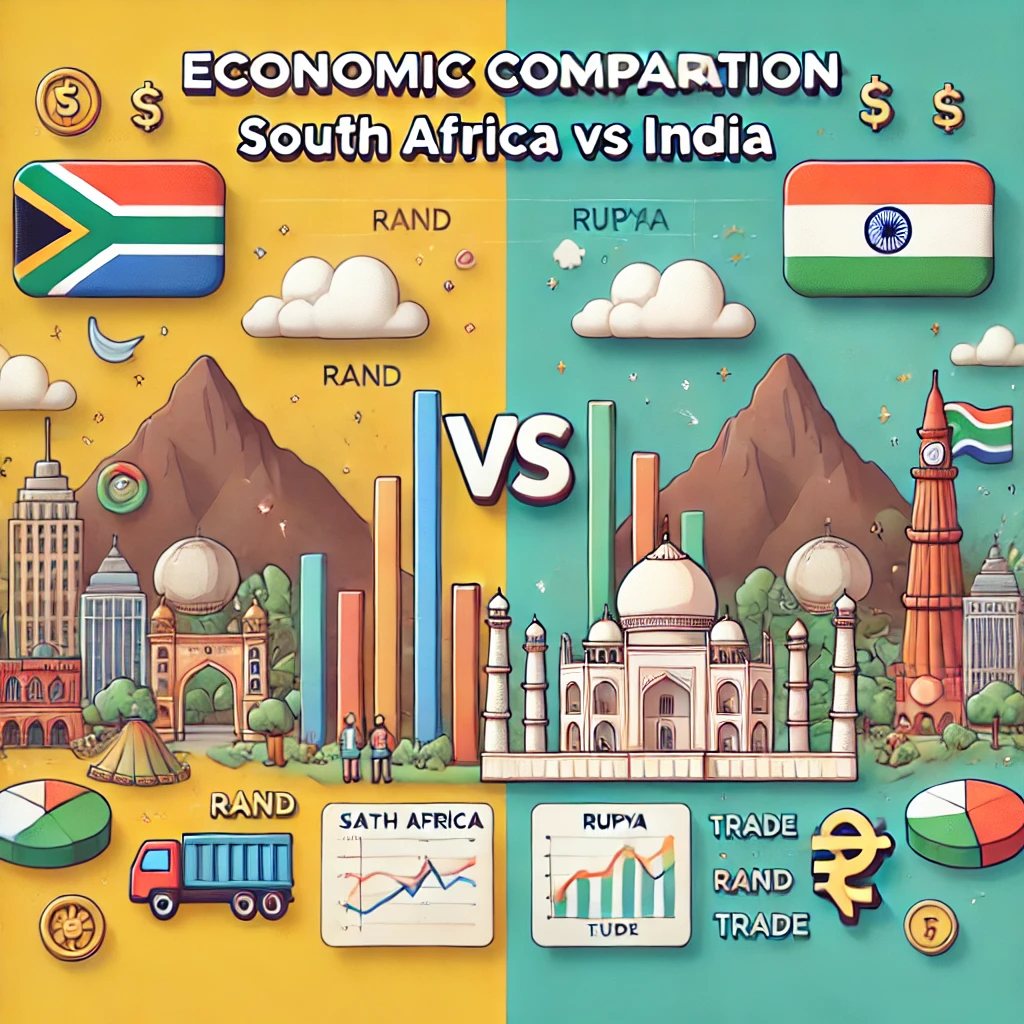
Economic Comparison: India vs South Africa
A comprehensive analysis comparing key economic indicators between India and South Africa. Visualizes trends in GDP, employment, trade relations, and living standards using interactive dashboards and data-driven insights.
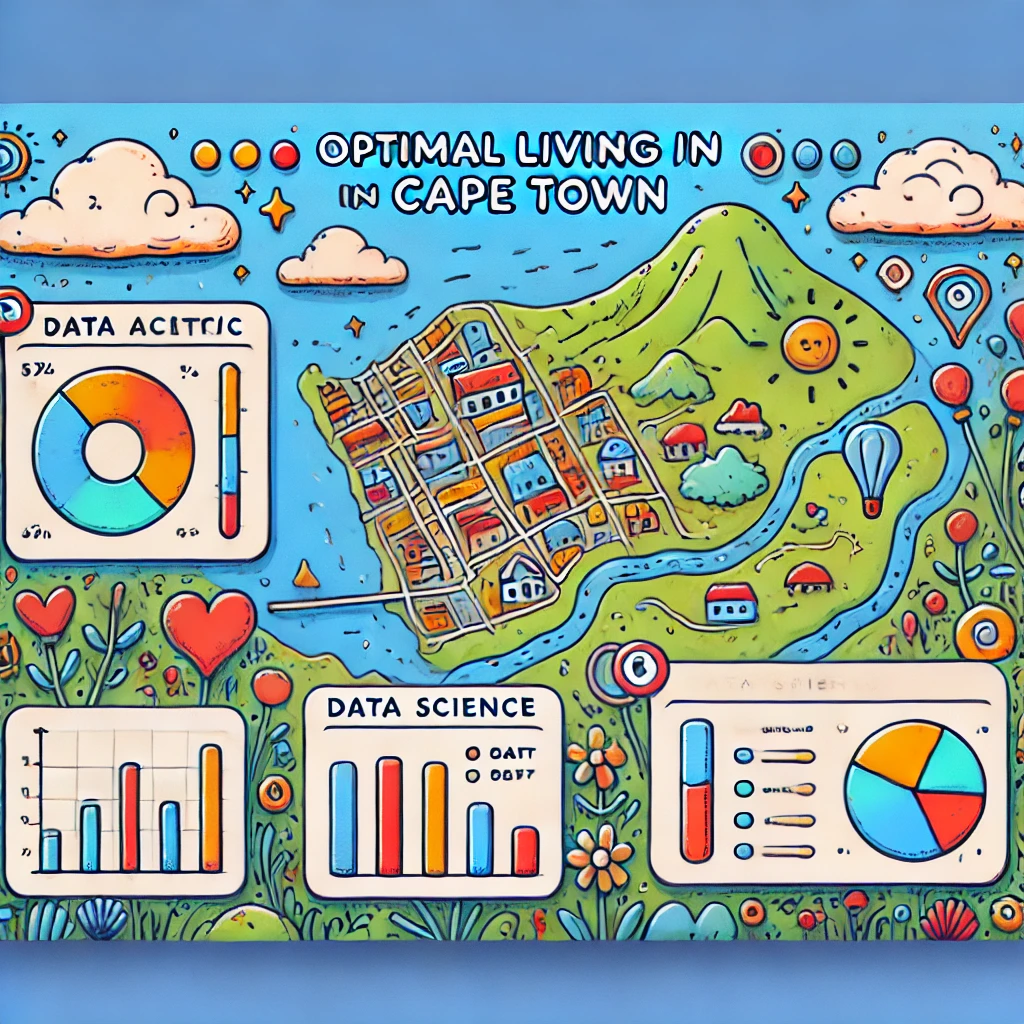
Cape Town Quality of Life Index
Developed a comprehensive model to identify optimal living areas in Cape Town by creating a quality of life index. Combined census data with real-time traffic information to analyze and visualize neighborhood livability scores.
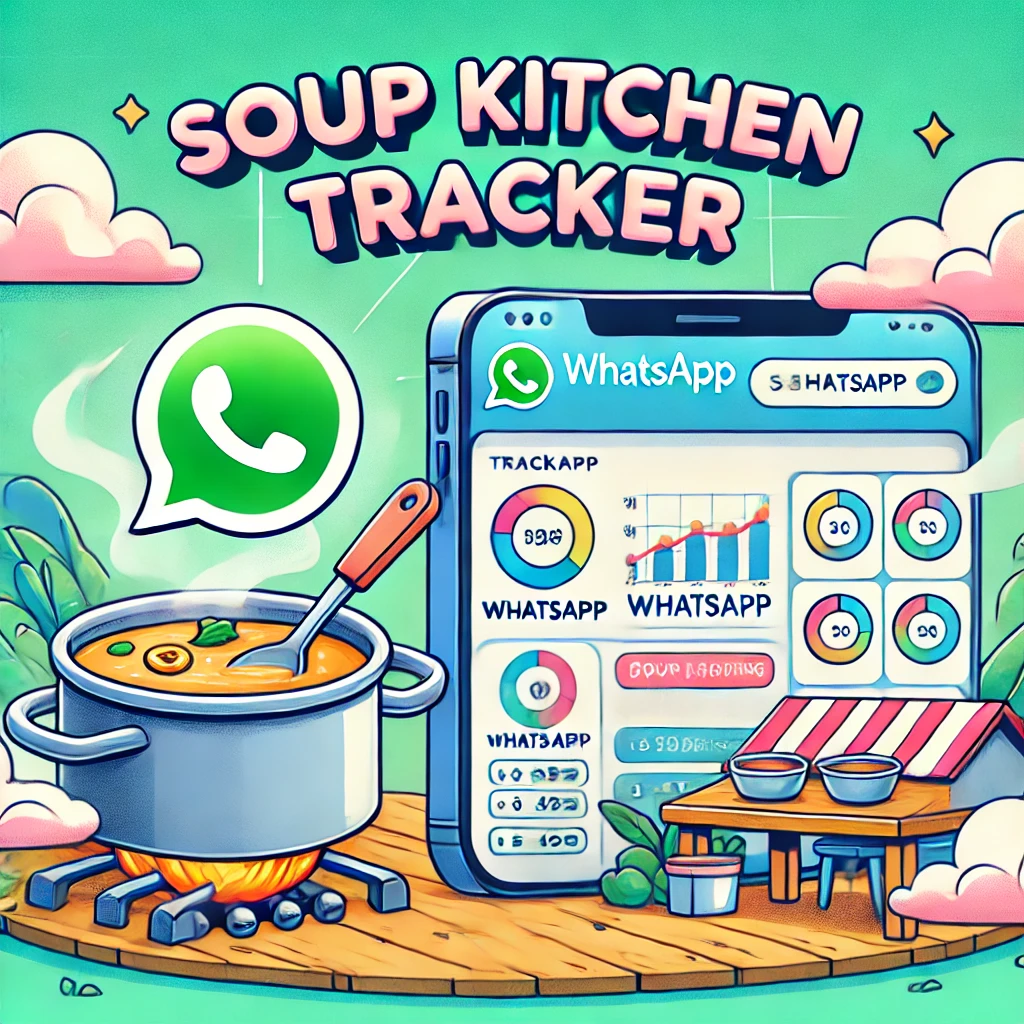
ObsCan Feed You - NGO Website
Created and deployed a website for ObsCanFeedYou charity to track and visualize the number of homeless people fed weekly. Implemented an automated data collection system using WhatsApp API and built interactive dashboards for data visualization.
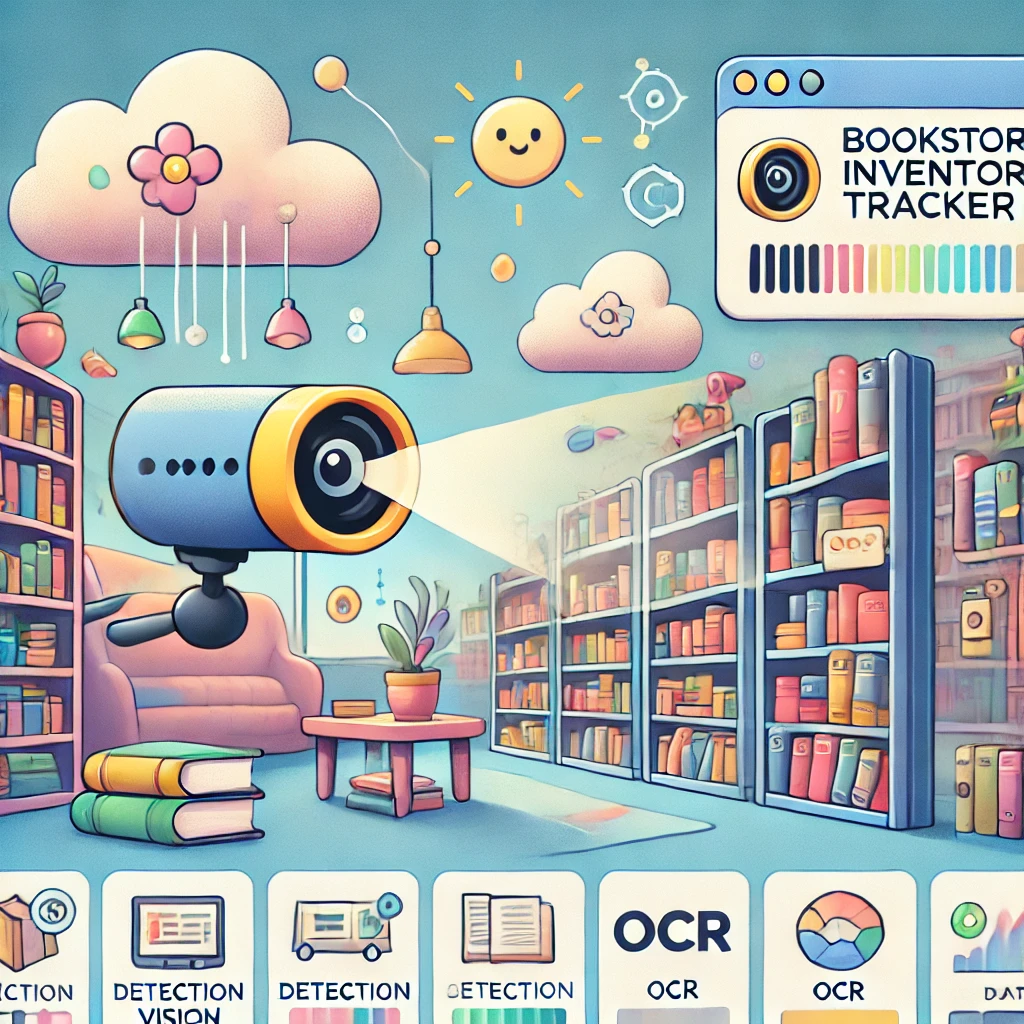
Papermoon Library Assistant
Built an AI-powered library management system that uses computer vision to scan bookshelves and automatically catalog books. Integrates with Google Vision OCR and Google Books API to create a structured database from bookshelf images.
ML Journey: From Accountant to ML Engineer
A comprehensive guide documenting my journey from an accountant with no computer science background to completing my first machine learning project. Includes detailed notes, practical examples, and learning resources for understanding ML fundamentals.